naxsi
Basic Setup
Architecture of naxsi configuration
- http {} level :
include naxsi_core.rules - server {} level :
- location {} level :
- location /RequestDenied
- return HTTP error code, post-processing …
Example configuration
#Only for nginx's version with modular support
load_module /../modules/ngx_http_naxsi_module.so;
events {
 ...
}
http {
 include /tmp/naxsi_ut/naxsi_core.rules;
 ...
 server {
  listen ...;
  server_name  ...;
  location / {
   #Enable naxsi
   SecRulesEnabled;
   #Enable learning mode
   LearningMode;
   #Define where blocked requests go
   DeniedUrl "/50x.html";
   #CheckRules, determining when naxsi needs to take action
   CheckRule "$SQL >= 8" BLOCK;
   CheckRule "$RFI >= 8" BLOCK;
   CheckRule "$TRAVERSAL >= 4" BLOCK;
   CheckRule "$EVADE >= 4" BLOCK;
   CheckRule "$XSS >= 8" BLOCK;
   #naxsi logs goes there
   error_log /.../foo.log;
   ...
  }
  error_page   500 502 503 504  /50x.html;
  #This is where the blocked requests are going
  location = /50x.html {
  return 418; #I'm a teapot \o/
  }
 }
}
Next steps
The next step is learning; however, before jumping there, ensure that you have:
- A nginx as a webserver or reverse proxy
- Naxsi installed and running in learning mode
- If you perform a request such as
curl 'http://127.0.0.1:4242/?a=<>', you should see a NAXSI_FMT in your logs :2016/07/12 13:27:04 [error] 14492#0: *1 NAXSI_FMT: ip=127.0.0.1&server=127.0.0.1&uri=/&learning=1&vers=0.55rc2&total_processed=1&total_blocked=1&block=1&cscore0=$XSS&score0=16&zone0=ARGS&id0=1302&var_name0=a&zone1=ARGS&id1=1303&var_name1=a, client: 127.0.0.1, server: localhost, request: "GET /?a=<> HTTP/1.1", host: "127.0.0.1:4242"
Learning, log-injection, ElasticSearch, Kibana
The ElasticSearch/Kibana part is optional but provides a great comfort and way to visualize “what’s going on”.
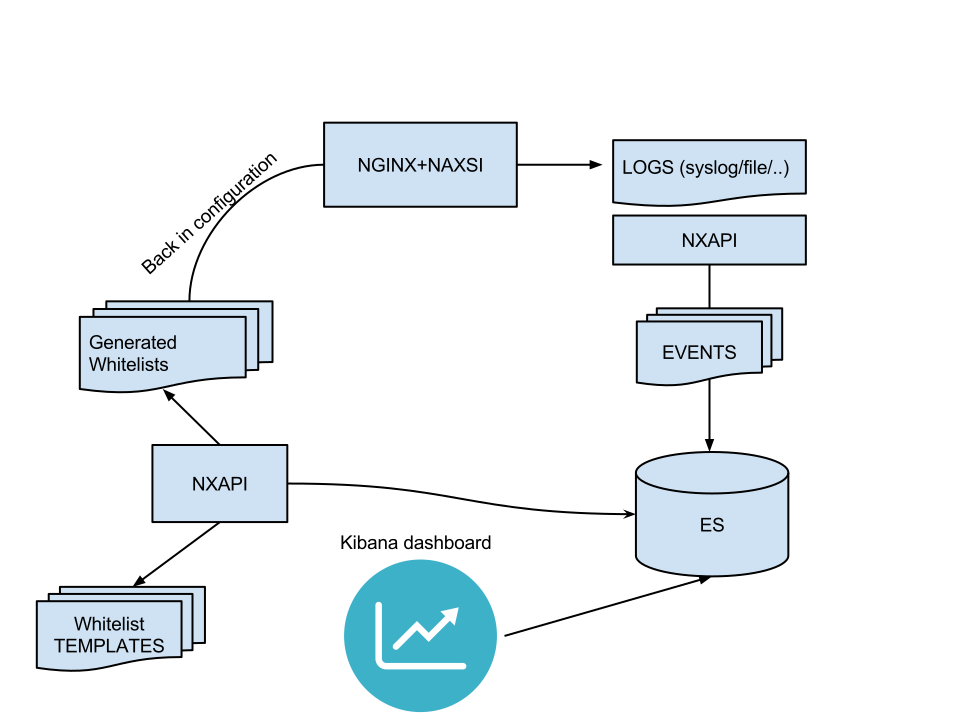
Components
Nxtool setup can be found here:
(tl;dr: python setup.py install, or ./nxtool.py -c nxapi.json -x)
Kibana (v4 as of this writing) can be downloaded here:
Once those two components are setup, you should be able to inject naxsi logs into ElasticSearch with NxTool. Here is an example of what it might look like in production:
Configuration - NXTOOL
As stated in dedicated documentation, nxtool comes with a json file specifying ES location, index etc.
"elastic" : {
 "host" : "127.0.0.1:9200",
 "index" : "nxapi",
 "doctype" : "events",
 "default_ttl" : "7200",
 "max_size" : "1000",
 "version" : "2"
},
Once configured and running on the same host as nginx, you can start injecting logs into ES:
nxtool.py --fifo /tmp/naxsi_pipe --no-timeout
(here, nginx is being told to write logs to /tmp/naxsi_pipe which is a FIFO created by nxtool)
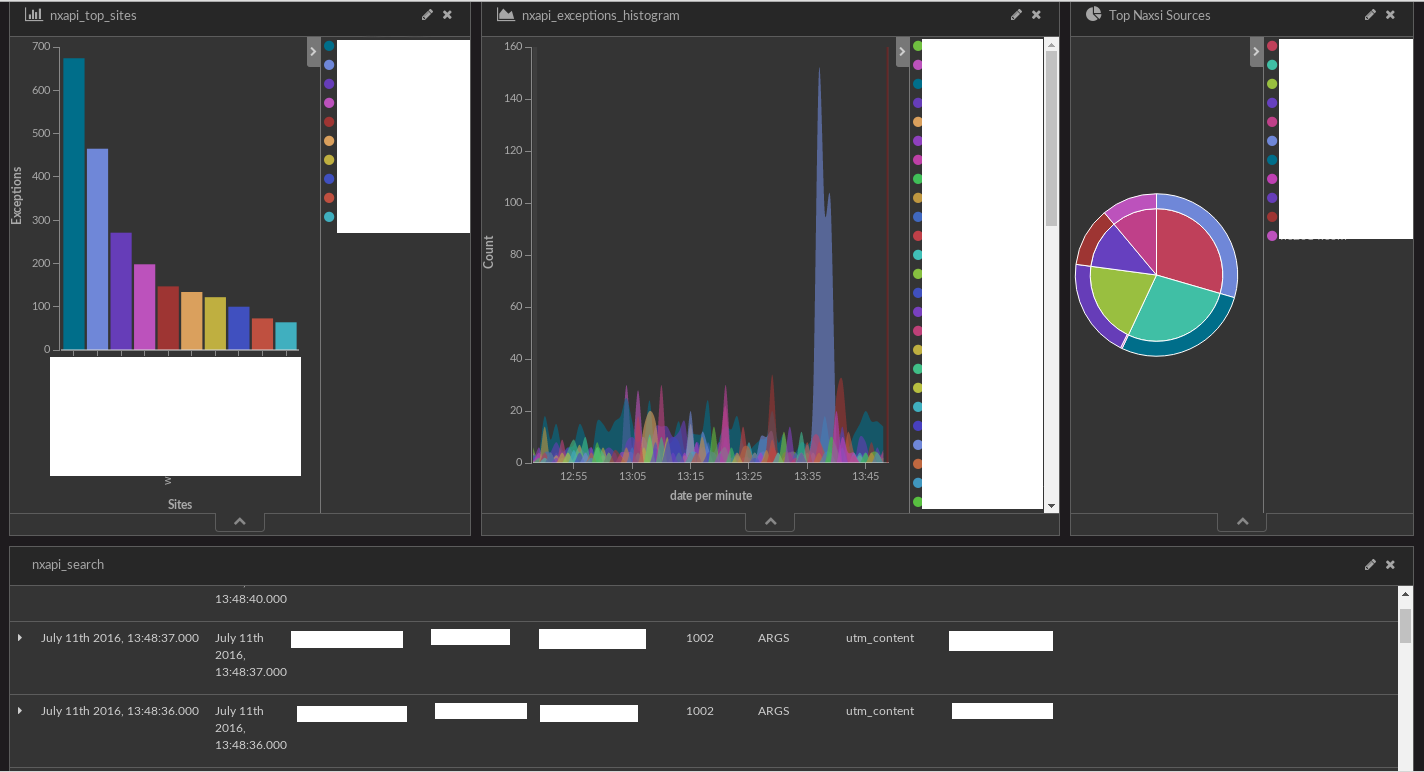
Configuration - Kibana
Now, you should be able to configure Kibana to setup a dashboard to visualize your naxsi data.
This step is left as an exercise for the reader, see Creating Kibana Dashboard.
Configuration - DataDog
Golden Setup
Blacklisting = mod_security
WAF = naxsi
https://gist.github.com/marcinguy/3a106991d3a84995efacc473f8db21a9
You can get logs to DataDog very easily using this Grok rule:
Grok Parser rule
myParsingrule %{date("yyyy/MM/dd HH:mm:ss"):connect_date} \[%{word:status}\] %{number:id}\#%{number:id2}: \*%{number:value} %{data::json}
Then you will see a nice Dashboard of Attacks
[[https://user-images.githubusercontent.com/20355405/90318948-4c52a700-df34-11ea-8521-259551b5322e.png]]
You can also send alerts to Slack:
[[https://user-images.githubusercontent.com/20355405/92943641-52fd0d00-f453-11ea-99ee-411d9ea33105.png]]
You just built an Open Source WAF solution with Alerts and Dashboard.